Introduction
The purpose of Field Activity 8 is to gain a working understanding of ArcCollector through the means of creating a geodatabase, deploying the project, and accessing it in ArcCollector. ArcCollector is a very useful application for mobile collecting of data in the field. It offers many of the good features of ArcGIS out in the field, all on a mobile device. This activity can help one learn how to deploy a project that is needed when group participation is needed in mapping an area without the ability to have one person go out in the field. This streamlines it and allows many to collect the data into one geodatabase.
Study Area
 |
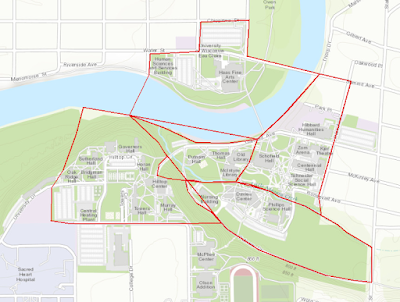
| Figure 1: Study Area |
The study area was the entire lower campus of UW- Eau Claire's campus. Many different groups went out to collect data in all of the delineated spaces in Figure 1. He(the writer) could not attend class, so the data was made available to him to study.
Results/Discussion
 |
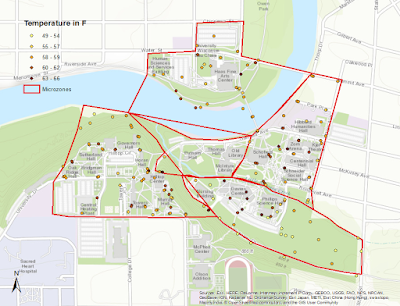
| Figure 2: Temperatures collected around campus in microclimates. |
The distribution of points suggests that the tree covered microclimates have a lower temperature, such as in the southeast microclimate, and part of the westernmost climate near the river. This can also be confirmed by the concentration of warmer temperatures collected near all of the buildings in the east microclimate, and the northernmost part of the southeast climate. These areas are all relatively treeless and would have less tree cover to absorb some of the radiation.
 |
| Figure 3: Dewpoints collected around campus within microclimates. |
 |
| Figure 4: Wind Speed Collected at different micropoints around campus. |
 |
| Figure 5: Wind Direction by Angle Collected around campus |
The wind direction map is an interesting way to look at the area. The directions tend to swirl near some of the buildings, but for the most part all head N NE and then head NW when it interacts with the river.
Conclusion
ArcCollector is a very effective means to collect information. The lab shows that the maps generated from collected data is very accurate and highly informative. With a large army of people, one could collect just about anything. It is a great tool to collect information that could be displayed on maps, and solves the goals of projects when planned out effectively.
I have gone through the site and read all blogs and this is a nice one:
ReplyDeleteGeospatially Referenced Radiation Surveys