Tuesday, December 20, 2016

Field Activity 12: Processing UAS Data with Pix4D

Pix4D Overview

Pix4D is a drone photogrammetry software that uses images to create point clouds, DSMs, orthomosaics and more. It is a survey workflow that allows for a variety of professional fields such as; construction, agriculture, and real estate to access quality software for analyzable results. Users can utilize Pix4D with any camera, photo, or it's app, Pix4Dcapture, to generate data that is easily shareable. It is available online or offline so no internet connection is needed.


Pix4D FAQs


  • What is the overlap needed for Pix4D to process imagery?
It is recommended that users have at least 75% frontlap and 60% sidelap.

  • What if the user is flying over sand/snow, or uniform fields?
With snow and sand in uniform areas, 85% frontlap and 70% sidelap is recommended.

  • What is Rapid Check?
Rapid check is a fast processing method that creates a visual surface very fast but with low resolution. This is great for field workers who need a quick check to view their work.

  • Can Pix4D process multiple flights? What does the pilot need to maintain if so?
Yes, Pix4D is capable of processing multiple flights. The pilot needs to maintain the same vertical and horizontal coordinate system throughout the whole project if they wish to merge multiple flights.

  • Can Pix4D process oblique images? What type of data do you need if so?
Pix4D can process oblique images. It is recommended to take images every 5-10 degrees if doing so, as well as capturing two sets of data at different heights.

  • Are GCPs necessary for Pix4D? When are they highly recommended?
GCPs are not necessary for Pix4D, but they are highly recommended especially when a project has no geolocation

  • What is the quality report?
The quality report is the description of how the data displayed after the initial processing. It gives a summary of the entire dataset, and how good of a quality result it processed in.


Using Pix4D/Methods 


When Pix4d is opened, Projects is clicked so that one can open a New Project. Name the project something relevant, hopefully coordinating with a naming convention, and save it where it can be found later. From there, the "Select Images" screen opens up. At this point, all of the flight image files collected with a drone can be added. Click on one image, and then hold shift and click the last image in a folder to add all images at once. Click "Next" once this is done, review the Image Properties, and within that page select "Edit" within the camera model to change the Shutter Model to Linear Rolling if the camera model used collects images this way. Click "Next" and review the Output Coordinate System page to ensure accuracy. Click Next and select the type of processing to be completed. In this case, it will be "AG RGB". Creating a study area can be helpful to make processing faster. To do this, select "Map View" and then select Processing Area and delineate the area wanted to study. When first running the processing, only select "1. Initial Processing" to view to data's quality before the rest of the processing can occur. This will generate a Quality Report to be viewed to ensure that quality is high enough to process. Once this is reviewed, the point cloud mesh and dsm, orthomosaic  and index can be processed.

CALCULATING AREA OF A SURFACE

1. Select the view
2. Select the rayCloud
3. Select New Surface
4. Click to select vertexes, and right click to finalize polygon

MEASURE LENGTH OF A DISTANCE

1. Select the view
2. Select rayCloud
3. Select New Polyline
4. Click to select distance to be measured

CALCULATE VOLUME OF 3D OBJECTS

1. Select view
2. Select volumes
3. Select New Volume
4. Click the vertexes around the object and right click to finish the object shape

CREATE A FLY-BY ANIMATION

1. Select view
2. Select rayCloud
3. Select the camera icon from the create box
4. Either choose User Generated Waypoints or Computer Generated Waypoints
5. Select the duration and speed of the flight
6. Save the file using the browse button
7. Render the video to save the file


Results


Figure 1: Mosaic image with the shapfiles of the distance, volume, and area calculation over-layed.


Figure 2: DSM result of Pix4D processing.


Figure 3: Fly-By Animation of entire captured area.


Pix4D Review


Pix4D is a great program for processing UAS imagery. Even those who have no knowledge of geographic skills could have a basic understanding of how to use the program. It creates high quality output with relative ease, and those who spend time getting to know how to use the ins and outs of Pix4D could create incredibly accurate photos for a variety of different professional applications. It may not be as accurate as LiDAR, but using the processing tools can make output that is usable if LiDAR is not accessible. 


Tuesday, December 6, 2016

Field Activity 11: Surveying Points Using a Dual Frequency GPS

Introduction

The field activity's purpose is to acclimate oneself with using a dual frequency survey GPS to collect points and create a continuous surface raster layer with the data collected. The topographic survey is meant to get students comfortable using the equipment in the field, using a recognizable land feature to visualize the results before bringing the points into ArcGIS. 


Methods


STUDY AREA

Figure 1: Study Area of the hill
The survey is completed by bringing a dual frequency GPS out to the hill in the center of campus of UW-Eau Claire. From there, students get in groups of three and take turns operating the GPS to collect points all along the hill to gather a comprehensive topographical survey. This is done by leveling the GPS receiver, and collecting the point on the survey GPS hand held touch screen. After the points are collected, the students go back to the lab to import a .txt file of the data into an xcel file. From there, the excel file is imported into ArcScene as a table. This table is then turned into xy data points, using the tool. From there, a variety of interpolations are completed to create a raster output image of the hill to be viewed in 3D.


Figure 2: Using the Dual Frequency GPS.


Results


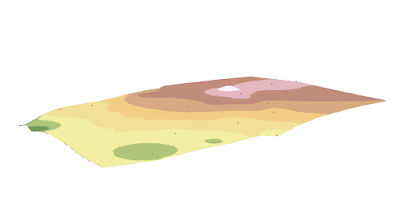
After the interpolations were ran, different results showed the data collection through different lenses. This was completed because of the different interpolation methods ran create the points between the points in different ways. The best interpolations for the students were probably the TIN  and Natural Neighbor interpolation. The outcomes were very similar to the sandbox field activity completed in terms of quality of actual representation.

Figure 3: IDW Interpolation Result

 The IDW result weighted the high point too much, which created a little tip in the center of the top of the hill. Other than the point, the rest of the hill was mapped fairly well.

Figure 4: Kriging Interpolation Result

The Kriging interpolation was a pretty good representation of the hill. It has a fairly gradual slope down, which imitates the actual hill very well.

Figure 5: Natural Neighbor Interpolation Result

The Natural Neighbor interpolation result is probably the second best interpolation for the various results. It used the outermost points to create a polygon that shows the actual shape of the hill that students naturally gravitated to to collect points around the size of the hill. The slope is represented fairly well too.

Figure 6: Spline Interpolation Result

The Spline interpolation was probably the worst representation of the topographic survey. It created much more dramatic inclines and slopes than were actually there.

Figure 7: TIN Interpolation Result
The TIN results were on par with the Natural Neighbor results in terms of quality. It created the actual shape of the hill, and provided a gentle slope where necessary, and more steep areas where the hill changed elevation much faster.


Conclusion

The field activity was very good to gain an understanding of how a dual frequency survey GPS works. These skills can be transferred to real world experience when working in the field. The technology worked very well for this activity, and allowed for a thorough completion of the topographic survey.